There are several quality control tools in Six Sigma, one of them being the fishbone diagram. It is mainly used in root cause analysis, particularly in the Analyze phase of the DMAIC methodology. Sometimes you will hear it being called the cause and effect diagram when project managers are using it for quality management.
What is a Fishbone Diagram?
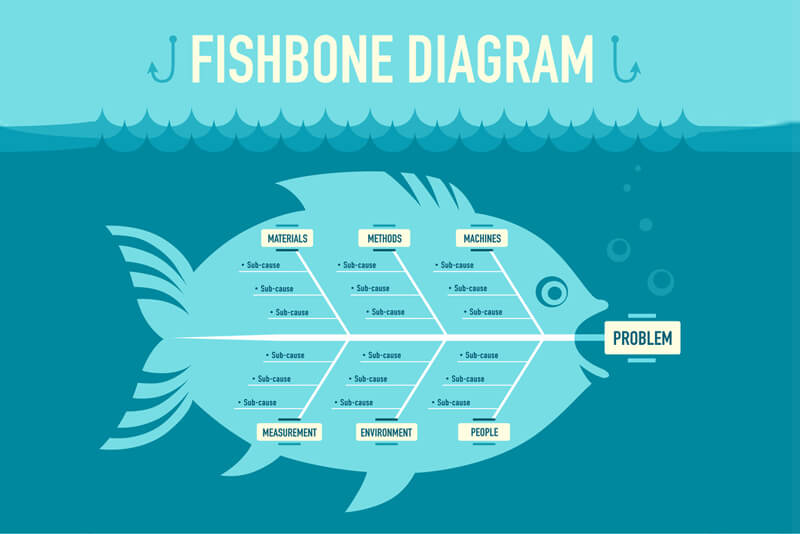
A fishbone diagram is a graphical tool that is used to identify all potential causes of a process or product failure. When drawn, the result looks like the skeleton of a fish – hence the name. It is used when thinking about root cause analysis on a higher level, leading to solutions that have the potential to solve the problem once and for all.
When we analyze a problem, we tend to put heavy emphasis on the obvious causes. These are the causes we think have the biggest impact on the problem we are experiencing with a particular process or product. But when the cause and effect diagram is used correctly, we can find out that the obvious cause we think is major is actually minor and vice-versa.
The fishbone diagram was developed in 1960 by Kaoru Ishikawa. He was a Japanese professor and expert in quality management. The fishbone diagram also goes by other names, such as the Herringbone diagram, Fishikawa diagram and Ishikawa diagram.
How to create a fishbone diagram
A fishbone diagram is undoubtedly an important tool, which can make one think that drawing the diagram is a complicated process. However, it is a relatively simple process. You just need to follow the steps below:
Identify the problem
You start by drawing a box on the right, which will serve as the fish head in the diagram. This is where you will write down the problem. From there, you will draw a horizontal line from the center to serve as the spine.
Categorize potential causes
The categories will be 45-degree lines that attach to the spine of the fish like bones. The category names can have generic names, such as material, method, machine, manpower, measurement and environment.
Brainstorm all potential causes
Place the potential causes of each category as sub-branches of each bone by drawing a horizontal line. If the cause belongs in more than one category, it is acceptable to include it wherever it may apply.
Learn More about Root Cause Analysis Training (RCA)
Analyze each cause
Look at each cause and ask yourself: Why did this happen? This will lead to further sub-branches that identify more potential causes.
Analyze the diagram
At this point, you have completed the fishbone diagram. All possible causes have been identified to the deepest level, allowing you to further analyze the diagram to find the root cause.
Conclusion
A fishbone diagram is at the heart of root cause analysis when a process or product misbehaves. It allows project managers to brainstorm all possible causes and investigate them further to uncover the root cause. It is a popular tool in Six Sigma and has led to the improvement of many processes in many organizations.


No responses / comments so far.