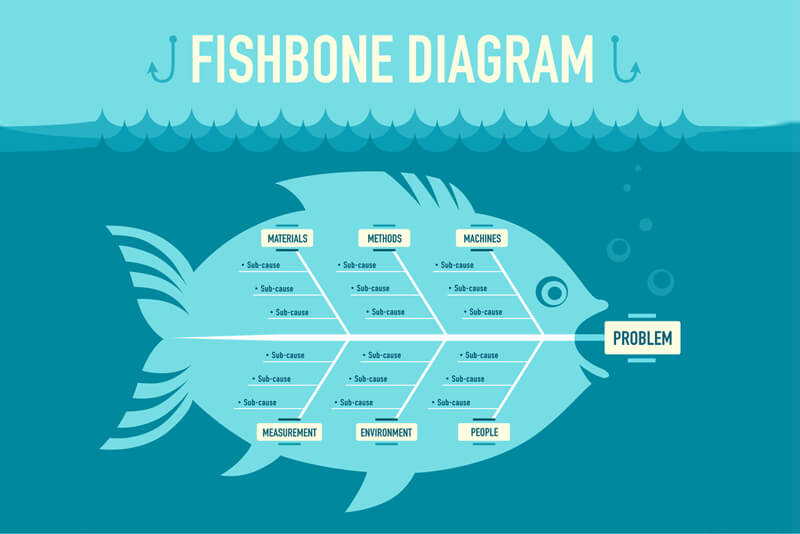
A fishbone diagram, also known as a cause and effect diagram or Ishikawa diagram, is an invaluable tool for root cause analysis. This graphical tool allows your team to brainstorm various potential causes and see how they relate to the problematic effect being observed. You can then investigate each effect and rule it out until you get to the root cause of the problem.
The structured approach to identifying potential problems that aren’t obvious at first glance is what makes fishbone diagrams effective. They are an easy tool to use but that greatly hinges on your team’s ability to brainstorm. Unfortunately, brainstorming sessions have a notorious reputation for being unproductive – yielding no usable ideas or information.
People who have led productive brainstorming sessions can attest to the usefulness of this diagram. However, there is no single fishbone diagram that can apply to every situation. Using the right fishbone diagram for the right situation is also key.

Always wanted to learn Six Sigma?
Try it at NO COST!
Check out the best-selling Six Sigma White Belt training program now!
Use coupon code:
SIXSIGMAWB
Here are a couple of fishbone diagrams that you can draw while you brainstorm.
Simple Fishbone Diagram
This is the basic and most commonly-used fishbone diagram. The affinities or sections are not predefined, allowing you to adapt it anyway you want to fit your organization and scenario. So if you are using it in a restaurant setting, you can make sure that your diagram is different from one that can be made in a manufacturing plant.
4S Fishbone Diagram
If your organization operates in the service industry, you will most likely use this fishbone diagram. All potential causes, along with their information, are grouped into four sections: systems, surroundings, skills and suppliers. You can use this fishbone diagram outside the service industry – as long as it applies.
8P Fishbone Diagram
This is another fishbone diagram that is popular in the service industry, although people in manufacturing and administrative function use it as well. This particular cause and effect diagram has eight sections, all of which start with a P – hence the name. These sections are procedures, policies, place/plant, products, people, procedures, price and promotion.
Man Machines Materials Fishbone
This Ishikawa diagram is based on the 6M’s of Six Sigma. These are man, materials, machine, methods, measurements and mother nature. These categories are mostly used to draw a cause and effect diagram in the manufacturing industry. It prevents people from focusing on the most obvious cause, which is man.
Design of Experiments Fishbone
Fishbone diagrams can also be used to help your team design an experiment. This is where you have a response variable and use the diagram to come up with factors for it. These factors are sectioned into controllable, held-constant, uncontrollable and unlockable nuisance factors.
Conclusion
You can’t use a single type of fishbone diagram to find the root cause in every situation. As you can see, there are at least five fishbone diagrams you can draw as your team tries to list down all the potential causes to an effect. You can use software like Minitab or draw it by hand – just make sure you are using the right fishbone diagram.
Global Six Sigma offers both Live Virtual classes as well as Online Self-Paced training. Most option includes access to the same great Master Black Belt instructors that teach our World Class in-person sessions. Sign-up today!
Learn more about our training and courses


Dear all,
Ofcourse gone throgh your vivid suggestions and apprecited me.
Im am interested to know a fish bone diagram for a PowerPlant Boiler operation and frequent failure , based on coal ,being facing operation failure. How to eleminate this failure please advise me the right isikawa diagram to follow the cause and effect.