I’ve written before that there are, at times, too many cooks in the kitchen. In that article, I quantitatively show how the number of communication links grows exponentially as the number of team members grow. This state of affairs adds tremendous burden to a system, as well as confusion, diffusion of responsibility and, most troubling of all, a lack of accountability: when everyone is in charge, then nobody is in charge.
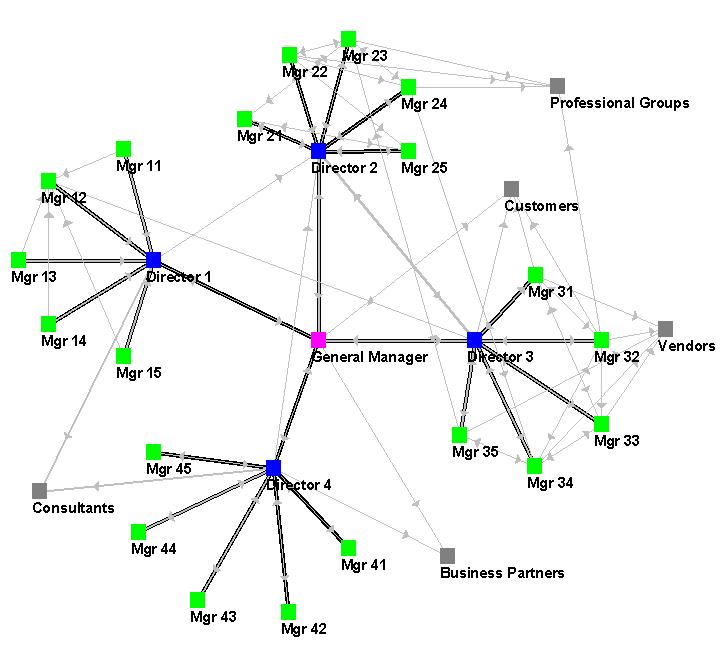
Here is another representation of complexity in organizations. This author [1. http://www.orgnet.com/decisions.html] shows visually what decision making looks like:

The arrows ( A => B) means that “A seeks B” and this visualization of decision making in organizations was obtained through user interviews and observation. Other insights:
- There is strong triangle of input and feedback amongst Directors 2 and 3 and the General Manager. These strong, trusting ties have grown and solidified over many years of working together.
- Director 1 is new to the organization. Manager 12 was hoping to get this position, but Corporate strongly pushed for Director 1. Notice that Manager 12 is still locally influential in the decision-making network. Director 1 does not include input from direct reports in decision-making [ remember A –> B means that A seeks out B ] !
- Director 4 is about to retire. He used to run this division when it was much smaller. Unlike Director 1, Director 4 does include inputs from his staff.
- The decision-making patterns in the departments of Directors 2 and 3 are quite different from the pattern of links in the departments of Directors 1 and 4. Directors 2 and 3 seek information from all levels of the organization — their departments show both vertical and horizontal flows. Several managers in these departments [23, 24, 34, and 35] are boundary spanners — connecting to others outside of their immediate group.
- Departments 2 and 3 are an example of participatory decision-making — including inputs from up and down the hierarchy, as well as inside and outside the department.
Who do you see as the most influential person[s] in shaping decisions in this organization?


Great article,
not to nit pick, but I take issue with the claim that links grow “exponentially” as the number of team members grow. A worst case scenario for communication here is just an example of the well known handshake problem, which grows quadratically as the number of participants. More precisely the maximum number of connections in a population of size n is n*(n+1)/2.