Similar to the principle of “Make it Obvious“, and “Make Problems Visible“, this principle is more about delivery than content. The content must be delivered “In a Glance” – that is, the user must look at it and understand immediately what he/she is looking at, know what he/she should do with that information, by when, and who are involved.
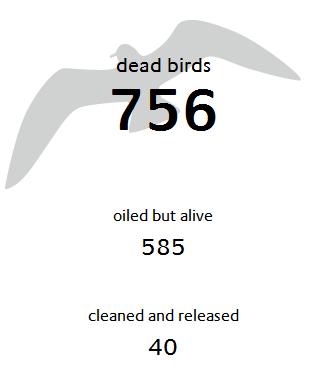
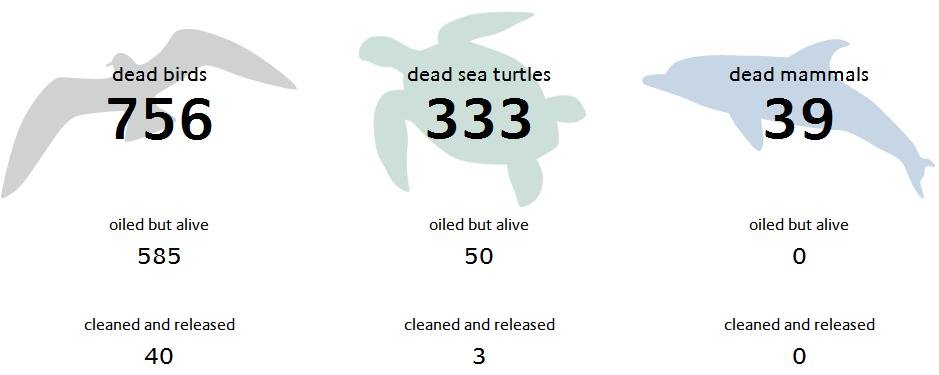
This example of an oil spill animals affected chart is good because it shows immediately the status. But, it fails to tell us what to do next, where to go, and the amount that is needed. But, as something that shows “in a glance”, it’s pretty good. In other words, it’s not a bad status indicator.
As an example, In a Glance, this site tells us how how many dead birds, dead sea turtles, and dead mammals there are from the BP Oil Spill; how many oiled but alive and how many cleaned and released.

In a Glance,

Straightforward. Simple. Informative. Very sad.
[contentblock id=37]


Whilst they show something visually, I’d like something that shows what action to do/where to focus next.
Perhaps they would be better if the other rows also featured scaled images to show that there is something that could be done to mitigate what has passed.
I would consider the table of numbers to be biased, showing only the negative side.
Disclaimer: this comes as someone who enjoys diving and sponsors turtles
Similar to Kevin W’s comment, although the picture does “communicate”, it falls short on the other elements of In a Glance.
1. what he/she should do with that information
2. by when
3. who are involved
I would like to see more examples of this, as I would like to apply it to my work. Very interesting.
Thanks,
Ryan