In the previous module, we learned Basic Statistics as used in Six Sigma. We learned that statistics is the language of Six Sigma and saw several real world examples from projects of how statistics can be used to improve operations and processes.
In this module, we learn how to use Z Values or the Z Score. It’s a rather obscure topic, but it’ll be helpful as you’ll see. At least some background or rudimentary understanding will help you. In practical terms, Minitab and Excel can help you with many calculations, but knowing what’s happening under the hood may help. This module is helpful, for example, in answering the question “What is the probability of a defect happening?” Learning how to calculate the Z Score will help you answer that question.
Before you read on, it’ll be helpful to review the section on Distributions.
1. Normal Curves
As we learned in the section on Distributions, the normal curve is actually a theoretical one, truly symmetrical about its mean and precisely defined by the mean and the standard deviation. Consequently, if you change either one of these factors, you change the shape of the curve. The area under the theoretical normal curve can be divided into six zones, three on each side of the mean. Each zone is one standard deviation in width. 99.73% of the values will lie between limits set by +3 standard deviations and -3 standard deviations. This has been proven by theory and has been confirmed by practice over history.

2. Z Tables
Each population could have a different mean and standard deviation and, therefore, an infinite number of normal distribution curves. The Z table standardizes the normal distribution results in one curve which is applicable to any data set that can be characterized by this distribution (approximately normal).
The numbers on the base line of the curve (the line the curve is sitting on) represent the number of standard deviations from the mean. The Z table renames these numbers to be the Z values and then further defines them in decimal fashion. Therefore, a Z value of -1.336 represents a point on the line that is -1.336 standard deviations from the mean.
- Z = the number of standard deviations that a point is away from the mean
- Z-Values have the following qualities:
- It has no units
- Numbers are small, since 99.73% of the X values have a resulting Z value between +3 and -3
- Only one cumulative probability table (Z table) is required, since any normally distributed X can always be reduced to a corresponding Z value
2.1 Calculate Z Values for Distribution of the Mean
To calculate Z values for the distribution of the mean, the following calculation is used:
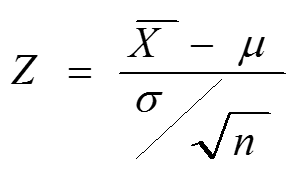
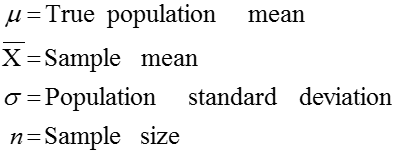
Where,
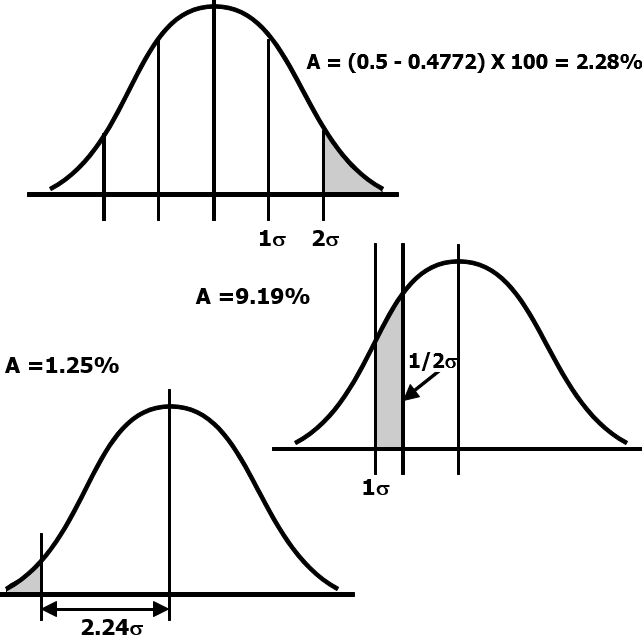
So, if we asked “What % of the Normal Curve is Darkened?”, we can answer this question using the Z Table.
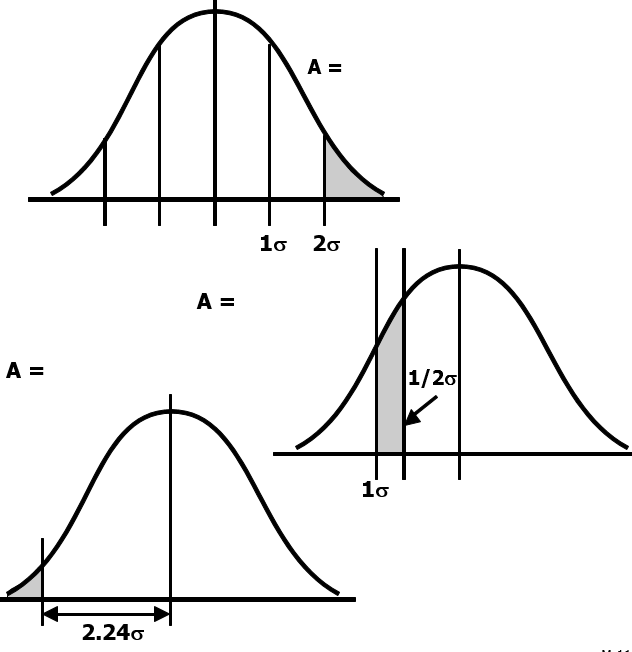
The Z Table below will help us answer this question.
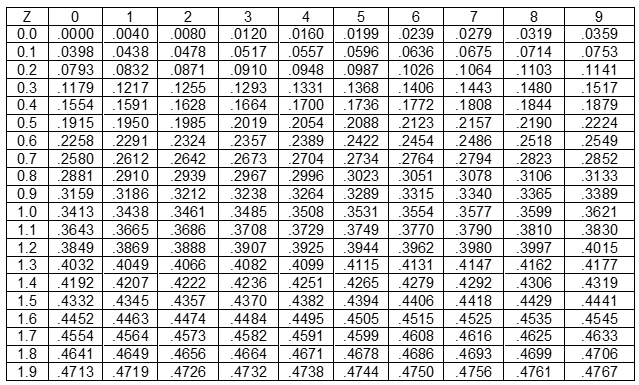
Now, to answer the question on how much of the curve is shaded, we get the following answers:
Now it’s your turn. Use the information above to solve the following question:
An engineer takes 35 measurements of the cycle time of an automatic case sealer. If the average cycle time of the operation is 4.55 seconds and the standard deviation of any given measurement is 0.92 seconds, what is the probability that the average of the 35 measurements will be between 4.3 and 4.7 seconds?
[contentblock id=16 img=gcb.png]


Comments are disabled for this post.