In the previous module, we learned to how to calculate the Z Score to estimate the probability of an event. You’ll need to know the basics of the Z Score in order to help you in this module.
In this module, we learn how to calculate sample size selection for Six Sigma projects.
Why Use Sample Sizes?
Data collection could take a long time and can become expensive. Instead of measuring an entire population, we instead take a sample from the population. Using statistics, we can ensure that the sample we obtain from the population is representative.
To obtain the sample size for Continuous Data, we use the following formula:
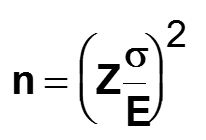
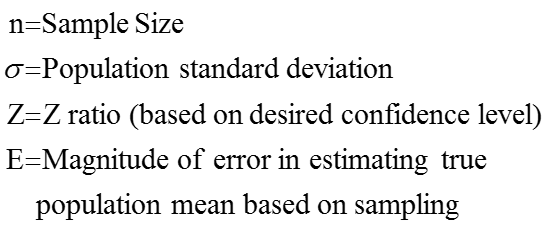
Where,
E is a chosen number based on the allowable error that the approximated average can be from the true average of the population. This formula is a direct result of the Z calculation for the distribution of the mean as we discussed in the module on the Z Score.
For Discrete Data, we use the following formula:
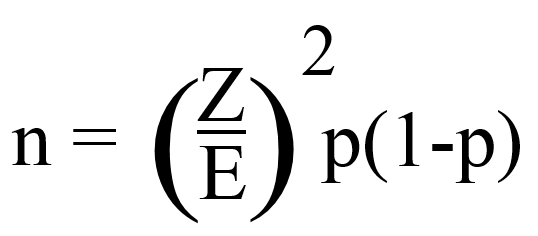
Where,
- n = sample size
- E = acceptable error
- p = proportion defective
- Z = Desired confidence level (use Z=2 for 95%)
We’ve also provided a sample size calculator for you in the templates section of your member page. These calculations are good for reference, but excel and/or Minitab are really the way to go to make life a bit easier so you can focus on the problem and solutions rather than on the statistics.
[contentblock id=16 img=gcb.png]


Comments are disabled for this post.